This post was created by Lindsey Tyne, Associate Paper Conservator, The Morgan Library & Museum.
Conservators in the Thaw Conservation Center (TCC) often spend time just looking at objects in the Morgan’s collection with the goal of understanding the physical structure of the object, the materials that make up the object, the support the object is made on, the techniques used to make the object, the object’s current condition, and even how the object may have looked at the time of its creation. The techniques used to look at works on paper in the collection can be separated into three broad categories. Visible Light, meaning the wavelengths the human eye can see; Non-Visible Radiation, which uses techniques to record radiation that our eyes cannot see; and Digital Manipulation (figure 1). This post is intended to set up a basic vocabulary of the common techniques found in case studies on this blog. Each technique is illustrated with an example of research undertaken in the TCC. It is common for these techniques to be used in combination, as sometimes one technique will reveal nothing, while another will provide just the right information, and often, when combined, they provide a deeper understanding of an object.
Normal Illumination
Raking Light
Transmitted Light
Magnification
Ultraviolet Induced Visible Fluorescence
Infrared Photography / Reflectography
Beta Radiography
False Color Infrared Photography (FCIR)
Reflectance Transformation Imaging (RTI)
[figure 1]
VISIBLE LIGHT: NORMAL ILLUMINATION
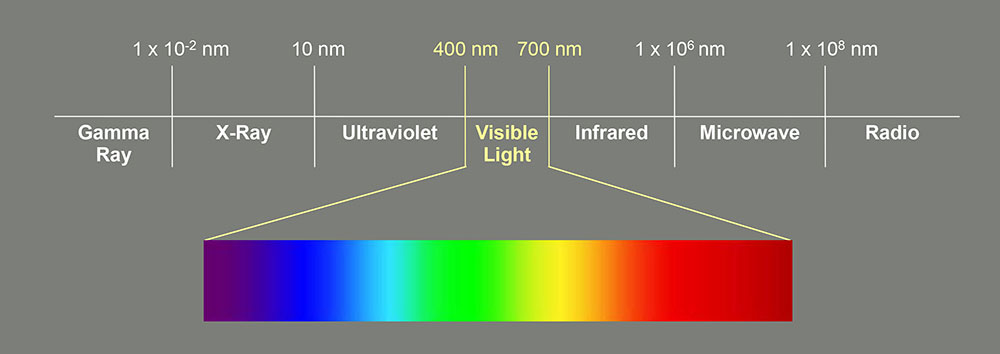
To begin, let's refresh our memories of the electromagnetic spectrum (figure 2). Notice that visible light is the narrow portion spanning approximately 400–700 nm. One of the most common ways to examine a work on paper is under normal illumination, where the object is illuminated evenly across its surface using visible light. Normal illumination is used to create images for a publication, as well as in a gallery setting, where each object should look its best. Viewing objects under this lighting condition provides information such as color, style, and scale. However, the direction of the visible light can be manipulated so the object does not look its best, in order to gather more information.
[figure 2]
VISIBLE LIGHT: RAKING LIGHT
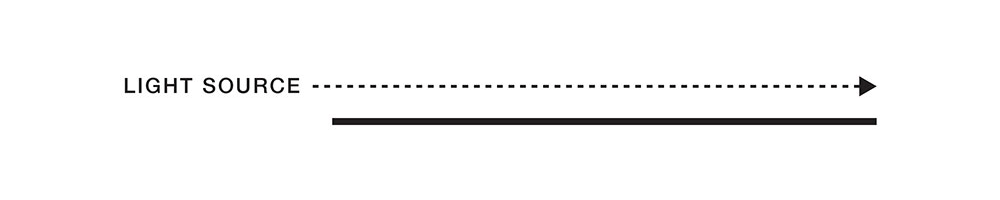
Let’s consider raking light. To view an object in raking light, a light source is positioned so that the light skims across the surface (figure 3). This technique is used to exaggerate textures.
[figure 3]
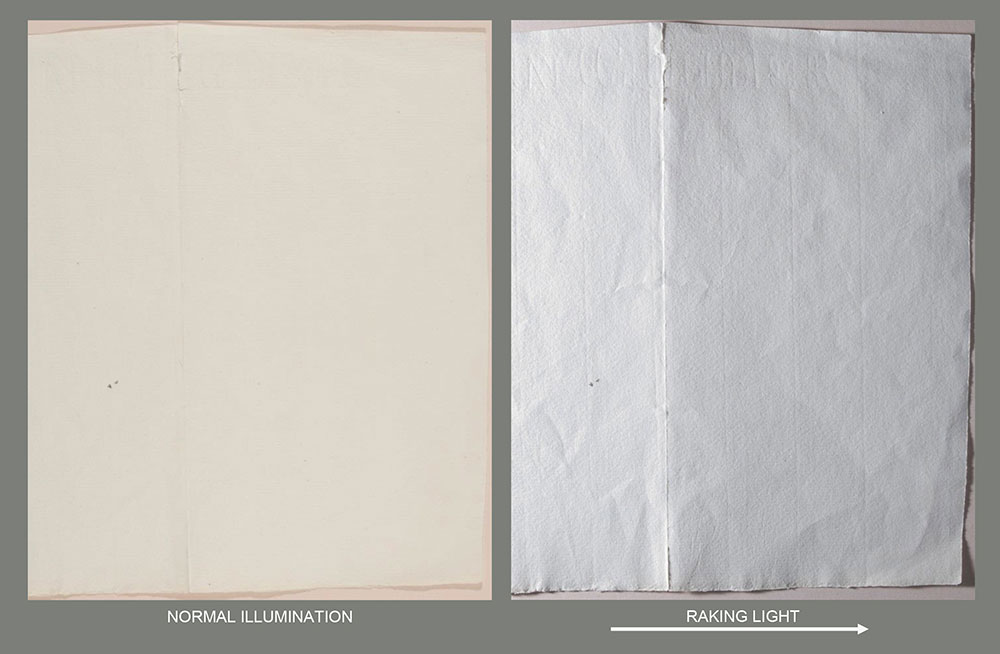
In this example, a single sheet of blank paper was imaged in normal illumination on the left and in raking light on the right (figure 4). In the left image, the paper appears smooth and flat, while the right image reveals the laid structure of the paper by exaggerating the texture of the vertical chain lines and the watermark at the upper edge. Raking light also highlights the vertical crease running through the sheet, tears along that crease at the edges, and shorter handling creases scattered throughout.
[figure 4]
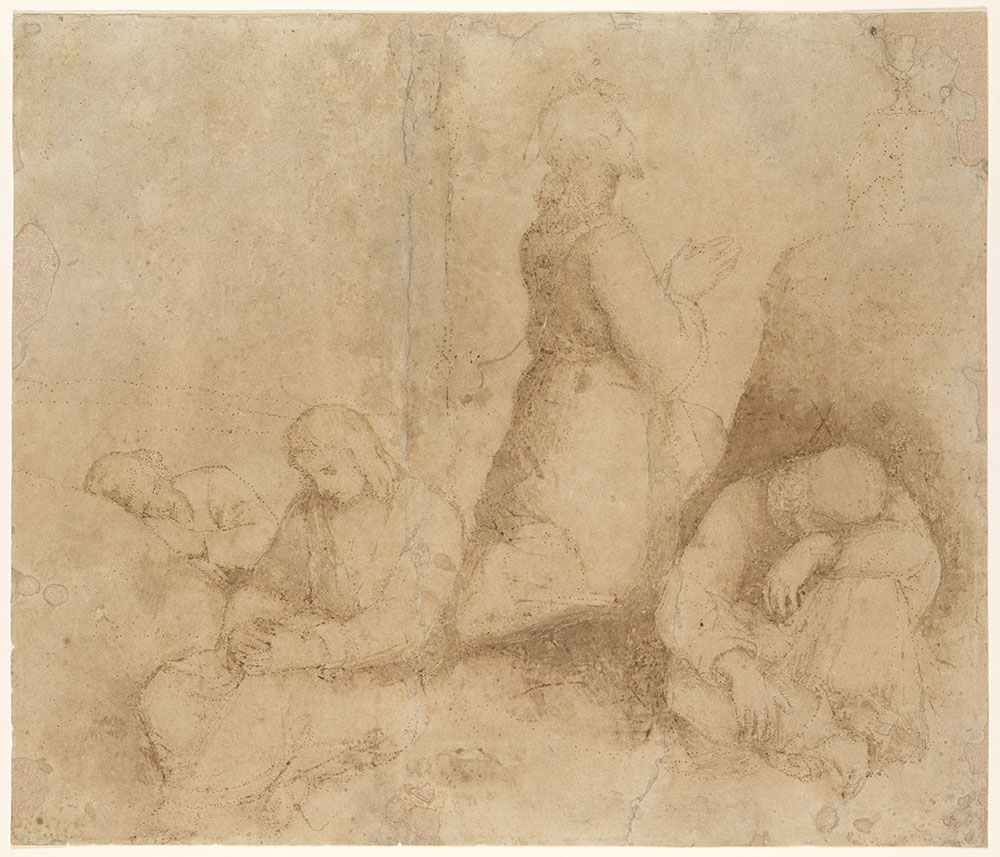
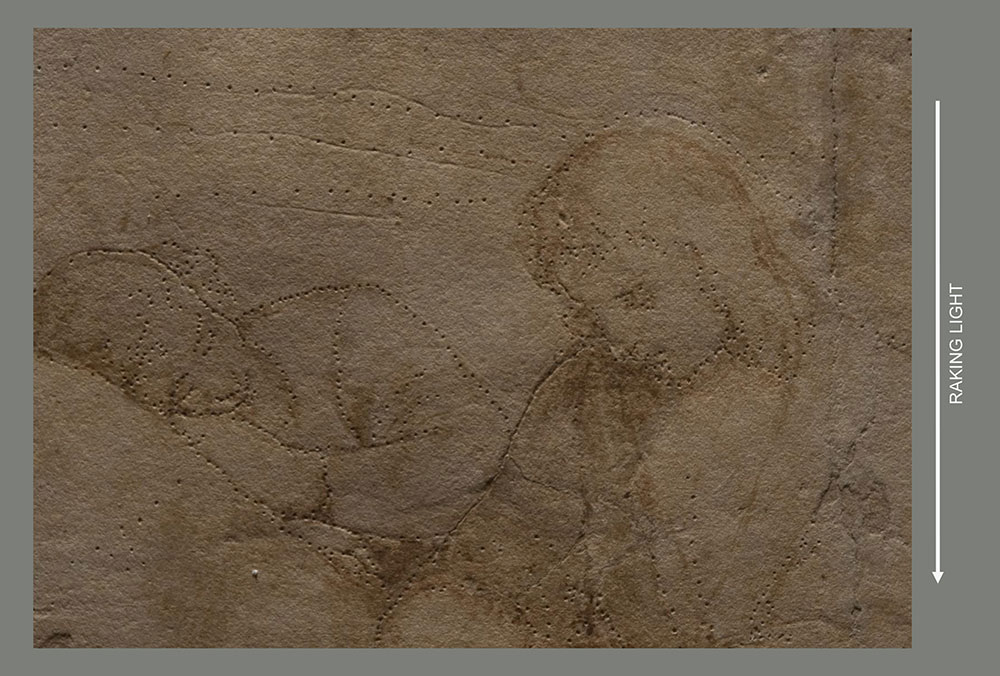
In 2008, Raphael’s Agony in the Garden, 1503–1505 (I,15; figure 5), was examined in the TCC. When viewed in normal illumination, the drawing seems rather flat, however with raking light, two types of marks are revealed. The first type is the long incised lines, and the second, the linear pinpricks seen in this detail (figure 6). These marks suggest that the sheet once served as a full-scale preparatory drawing for Raphael's Colonna Altarpiece.
Read more about this drawing and the altarpiece.
[figure 5]
[figure 6]
VISIBLE LIGHT: TRANSMITTED LIGHT
While raking light reveals information about texture, transmitted light reveals internal structure. In this technique, the light source is placed so that the light passes through the object causing thinner areas of the paper to appear lighter and thicker areas to appear darker (figure 7).
[figure 7]
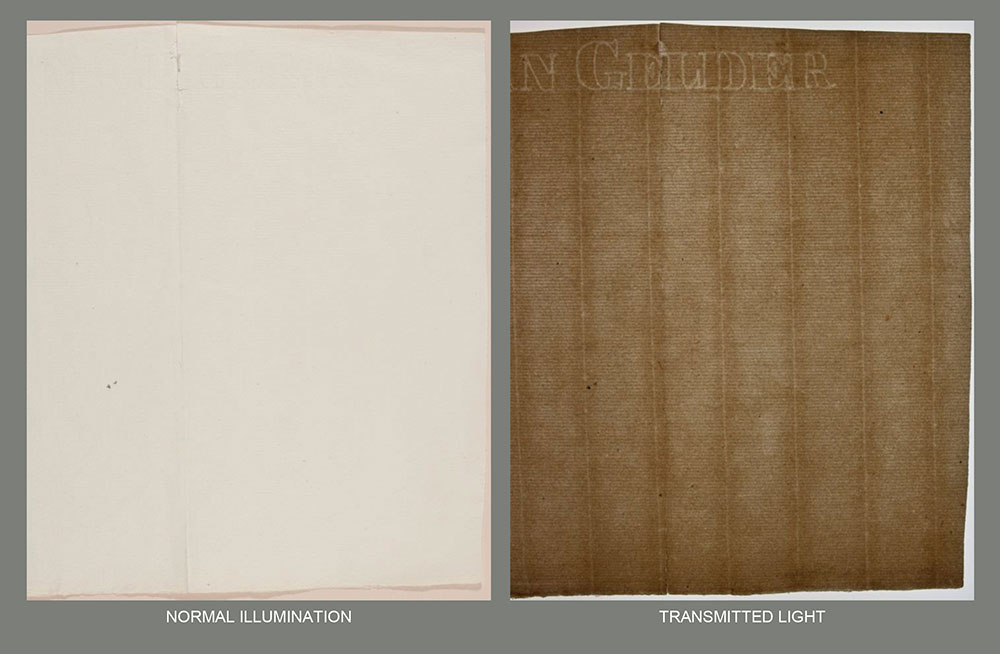
Let’s return to the blank sheet of laid paper. Here, the sheet was imaged in normal illumination on the left and in transmitted light on the right (figure 8). In the left image, the paper appears opaque, smooth, and flat, while the right image reveals the thinner vertical chain lines, the horizontal laid lines, and a partial Van Gelder watermark in the upper left. Transmitted light also reveals the thicker accumulation of paper pulp along the vertical chain lines as a nonuniform shadow, indicating that this sheet was made by hand.
[figure 8]
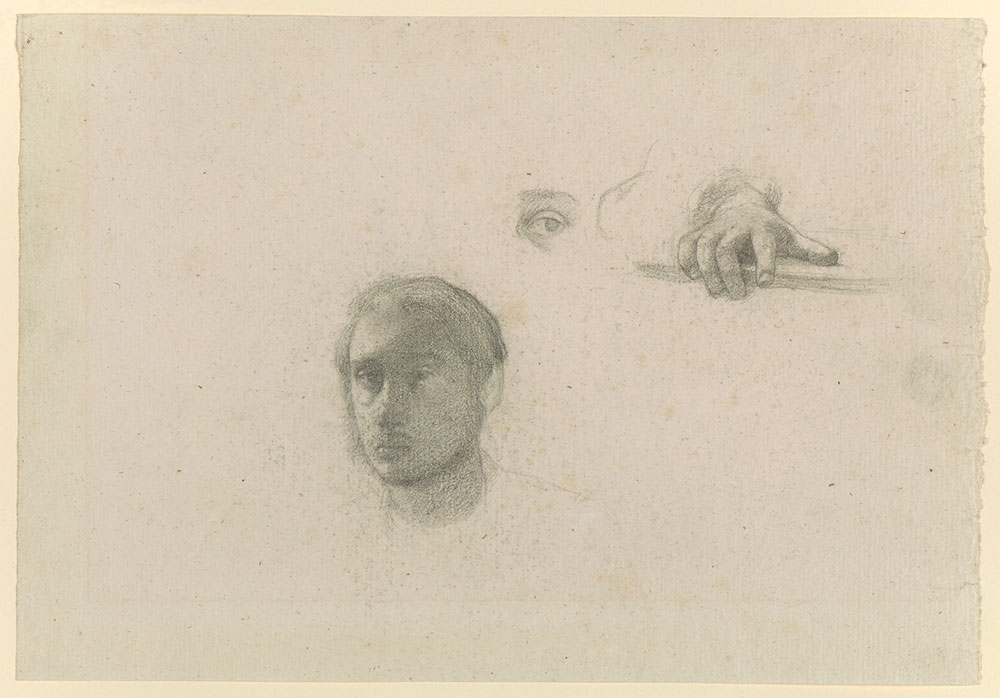
This technique works the best when the media is thin or only covers a portion of the sheet, such as the black chalk in Edgar Degas’ Self-Portrait and Details of Hand and Eye, ca. 1856–1857 (2010.117; figure 9). Transmitted light reveals that the sheet is a handmade laid paper with horizontal chain lines and a clear watermark close to the right edge reading “F. Camera” (figure 10). It also reveals that the right edge is an irregular deckle edge with its characteristic uneven pulp distribution that was formed during the papermaking process.
[figure 9]

[figure 10]
VISIBLE LIGHT: MAGNIFICATION
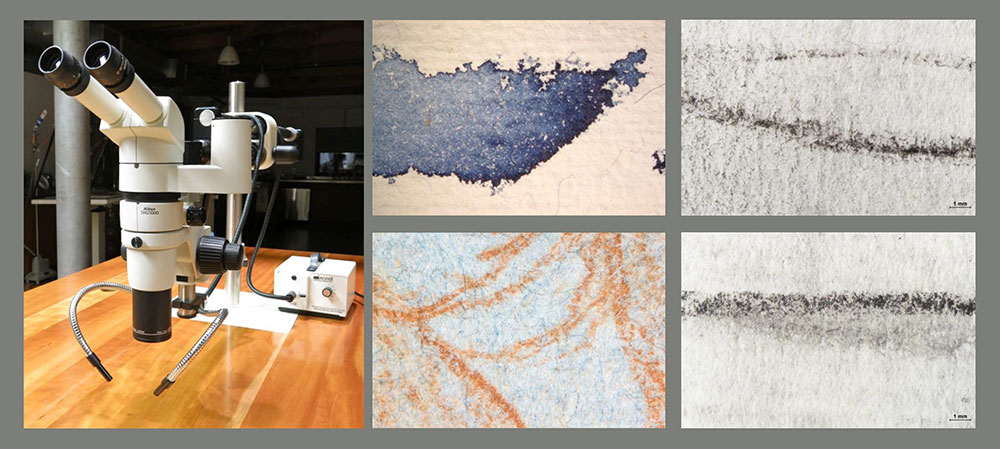
Magnification can be used to examine both the paper and the media. This is one of the stereomicroscopes in the TCC and four images taken through the microscope (figure 11). Observe the nature of the blue watercolor stroke in the upper left image; the way red chalk sits on the surface of a blue paper, which is made of blue and cream fibers, in the lower left; the black particles that form the chalk line in the upper right; and the slight metallic nature of graphite in the lower right.
[figure 11]
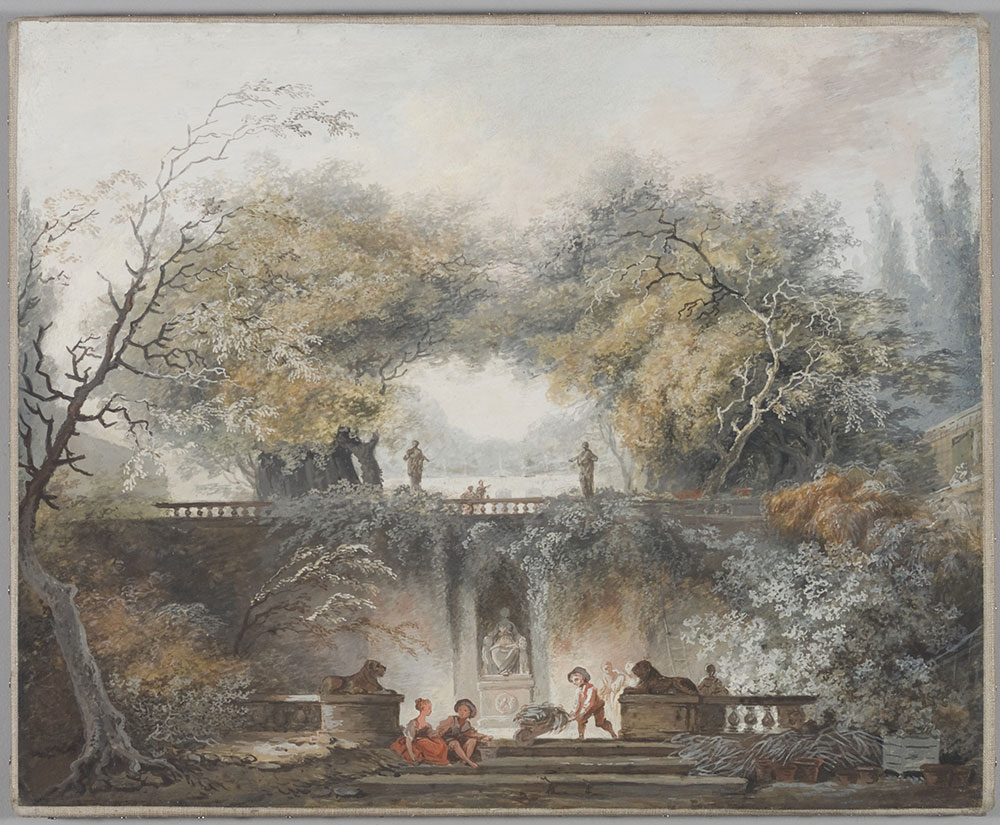
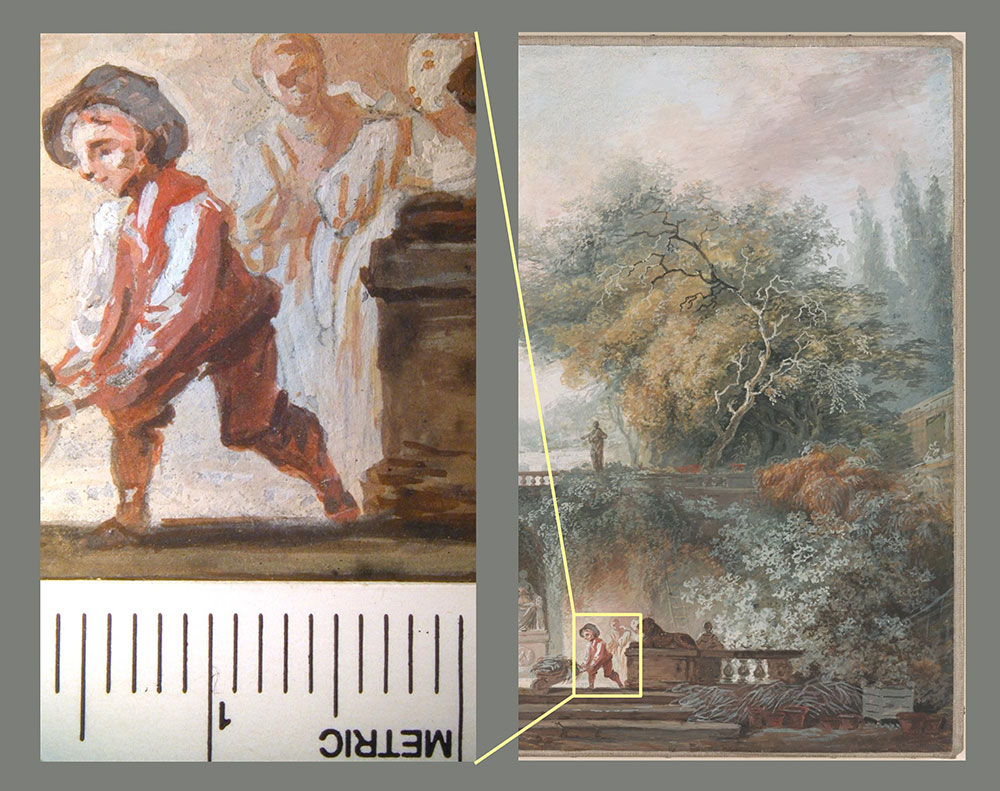
Let’s use magnification to look at the layering of media in Jean-Honoré Fragonard’s The Little Park, ca. 1765 (1997.85; figure 12). When the figure in the lower right is magnified, the layered strokes of opaque watercolor are easily observed (figure 13). Note that the gray graphite underdrawing is partially visible between some strokes of the white watercolor in the figures’ clothing, and in other areas is completely covered. The underdrawing is not readily apparent when this object is viewed without magnification.
[figure 12]
[figure 13]
NON-VISIBLE RADIATION: ULTRAVIOLET INDUCED VISIBLE FLUORESCENCE
Moving to the left of visible light on the electromagnetic spectrum brings us to ultraviolet radiation (UV), with wavelengths ranging from approximately 10–400 nm that are not visible to the human eye. A portion of this region, known as UVA (315–400 nm), causes some materials to glow or fluoresce visible light, allowing differences between materials to be detected. This can aid in the identification of media, assessment of condition, and sometimes reveal things not seen in visible light.
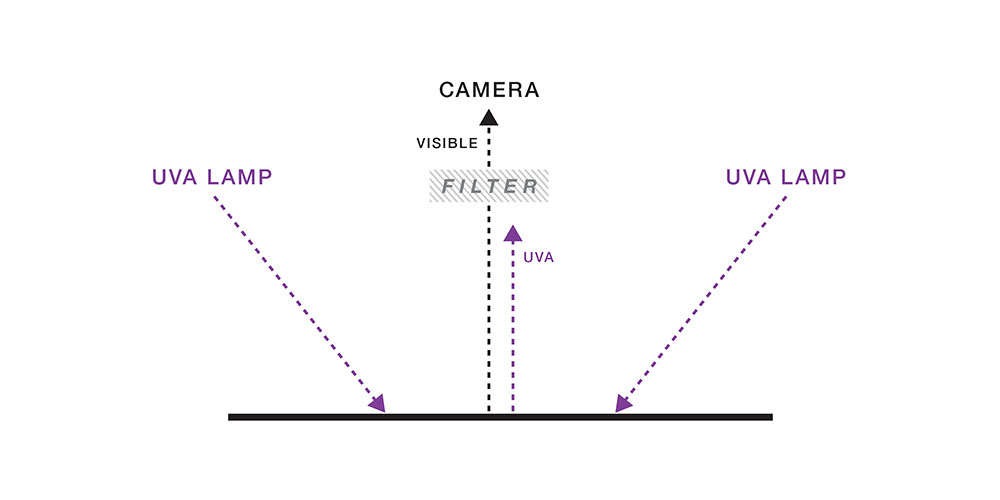
In this diagram, the object is subjected to UVA radiation (figure 14). The object reflects some of the UVA wavelengths and fluoresces visible light wavelengths; this is called ultraviolet induced visible fluorescence. To capture an image of only the fluorescence, a filter is used to block the UVA wavelengths from the camera.
[figure 14]
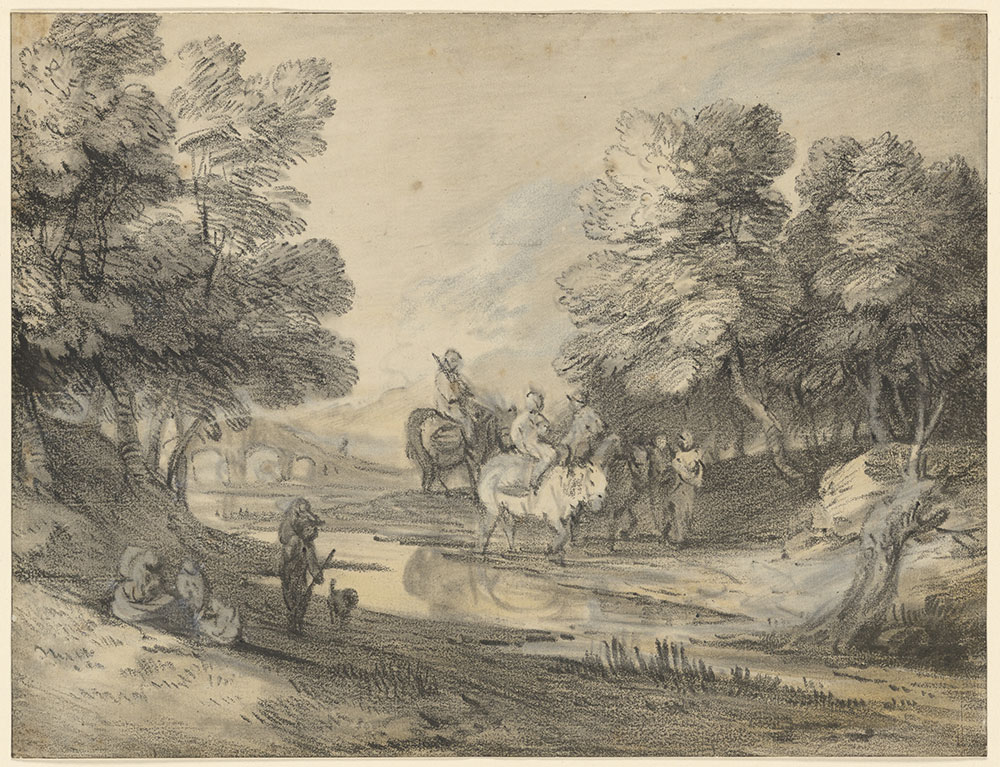
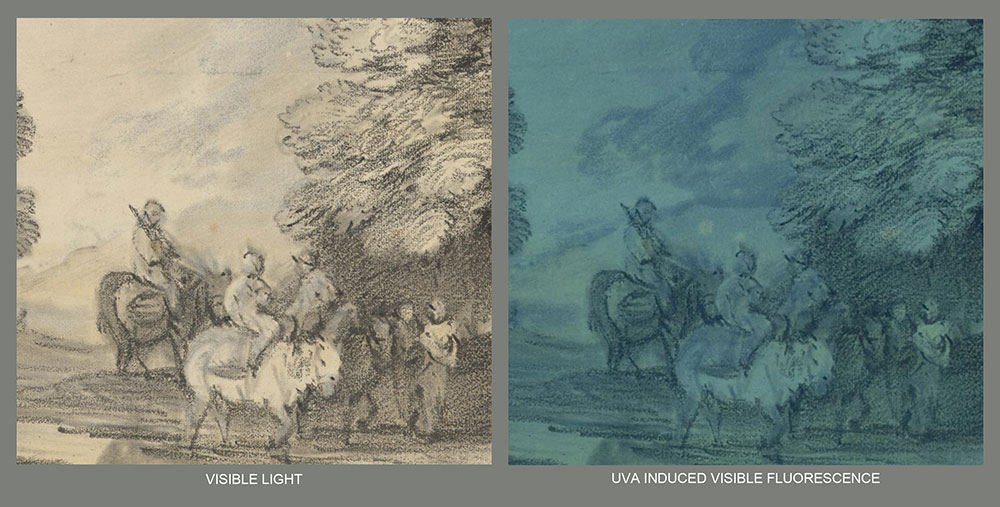
In 2017, the ultraviolet induced visible fluorescence of Thomas Gainsborough’s Wooded Landscape with Horseman, Figures, and Bridge, ca. 1780 (III, 61; figure 15) was captured to document his use of opaque lead white. This technique increased the visual contrast between the media and the support by rendering the lead white as a dull gray-blue in contrast to the slightly fluorescing paper. Note that the wide strokes of lead white used in the sky and figures are revealed in this detail (figure 16).
Read more about Gainsborough’s drawing techniques in a catalog essay by Reba F. Snyder, Paper Conservator in the TCC, published in the Morgan’s exhibition catalog Thomas Gainsborough: Experiments in Drawing, 2018.
[figure 15]
[figure 16]
NON-VISIBLE RADIATION: INFRARED PHOTOGRAPHY / REFLECTOGRAPHY
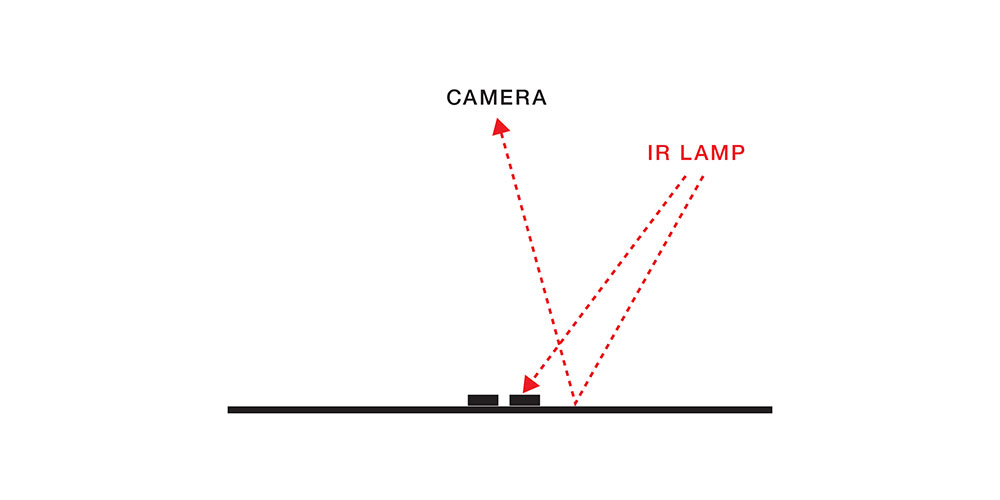
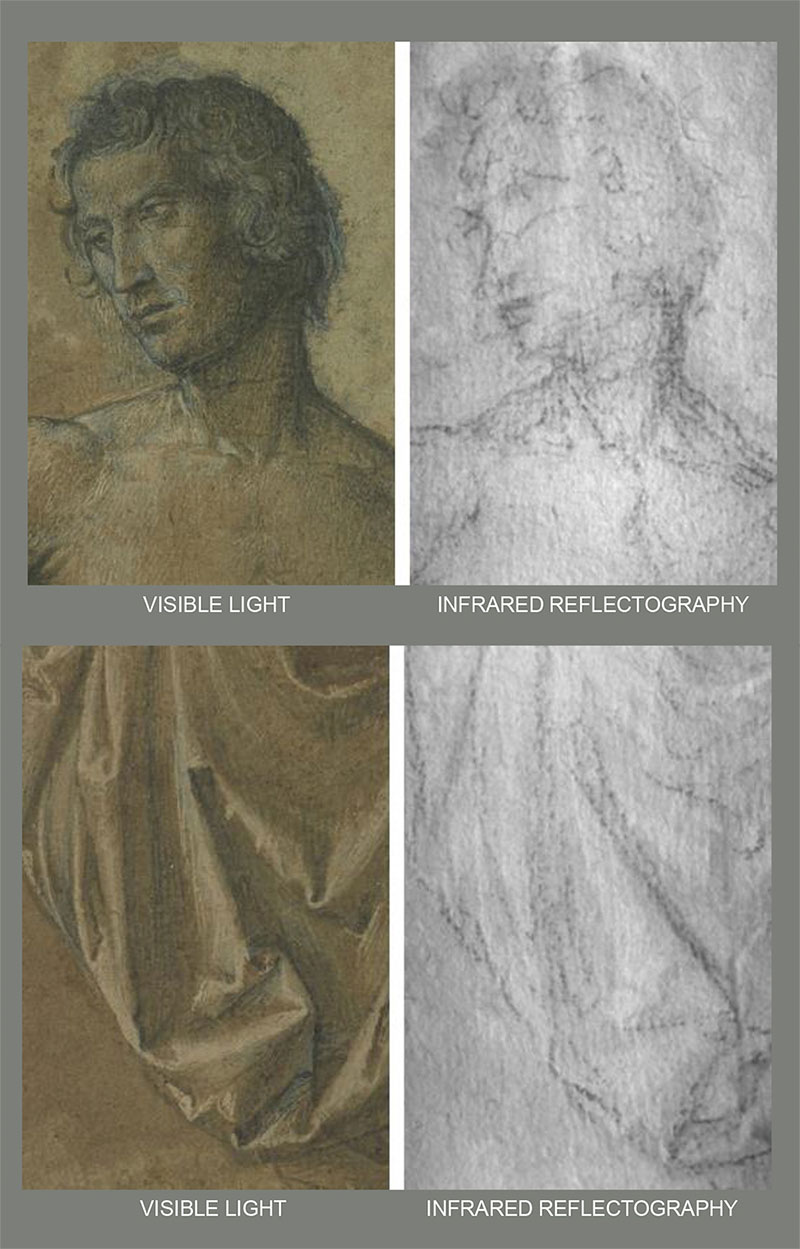
To the right of visible light on the electromagnetic spectrum is infrared radiation (IR). When a drawing is subjected to IR radiation, its media will either be transparent to, absorb, or reflect the wavelengths in varying degrees. In this simplified diagram, IR wavelengths are reflected back to the camera from the paper support, while the carbon-based drawing media absorbs the IR wavelengths ( figure 17). The camera records this as white for the support and black for the drawing media. The term IR Photography is used for modified digital SLR cameras that can detect wavelengths up to 1000 nm, while IR Reflectography is used for short-wave infrared (SWIR) cameras that can detect wavelengths longer than 1000 nm. This technique can be used to detect inscriptions, distinguish between chemically different inks and pigments, and sometimes reveal underdrawings.
[figure 17]
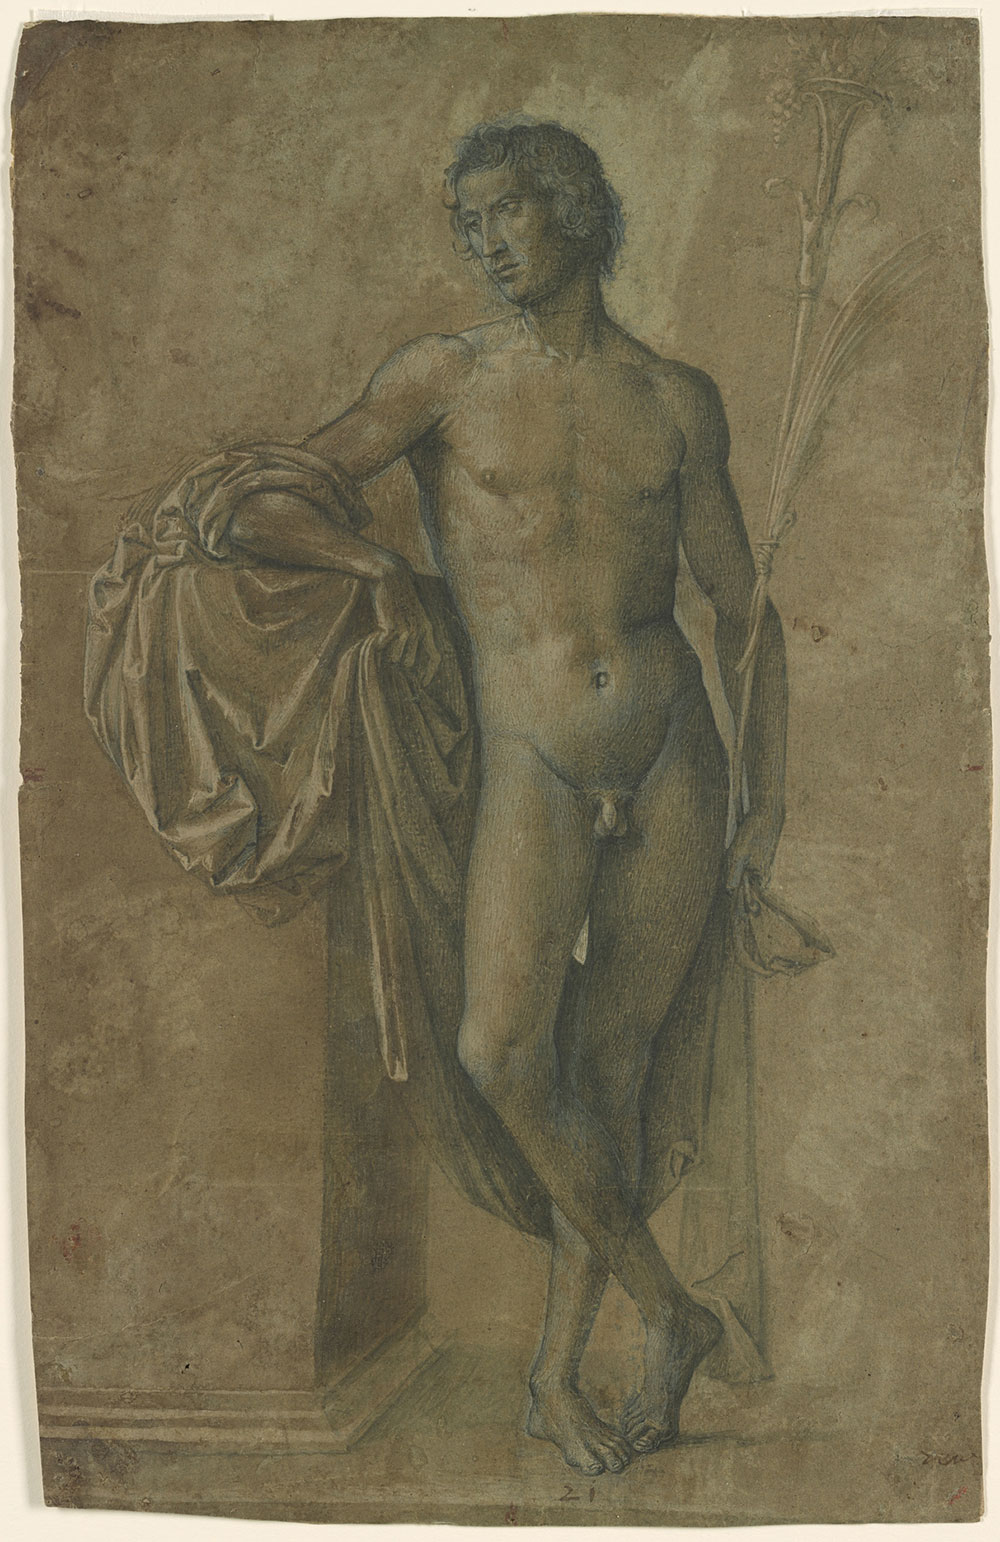
Let’s consider Nude Man Standing beside a High Pedestal, ca.1515, attributed to Bartolomeo Montagna (1974.1; figure 18). When this drawing was imaged with a SWIR camera, the black ink, brown washes, and white opaque watercolor became transparent, allowing the camera to clearly capture the black chalk underdrawing not visible to the human eye in these details (figure 19).
[figure 18]
[figure 19]
NON-VISIBLE RADIATION: BETA RADIOGRAPHY
Beta radiography is an imaging technique that uses a beta particle (an electron emitted from the nucleus of a radioactive atom) to record the internal structure of paper on film. The beta particle source in the TCC is a thin sheet of acrylic (polymethacrylate) containing radioactive carbon-14. This is a technique often used for documenting watermarks. To perform this technique, the beta source is placed in contact with the paper and x-ray film is placed on the opposite side (figure 20). The exposure time, ranging from thirty minutes to twenty hours, depends on the strength of the source and the thickness of the paper.

[figure 20]
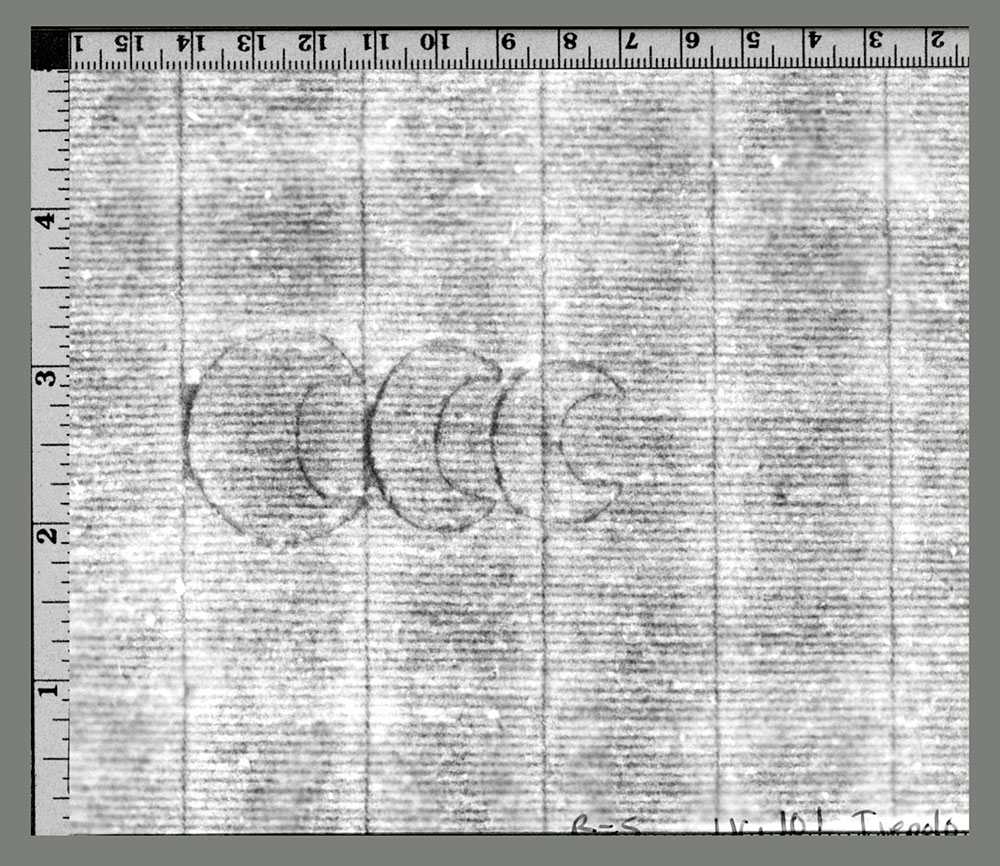
The result is a beta radiograph, a 1:1 ratio negative photographic image of the paper’s density and, in some cases, the media. The thinner areas of the paper appear darker on the radiograph, while the thicker areas are recorded as light areas. In this example, the vertical chain lines, horizontal laid lines, and the watermark of three crescent moons were recorded on the film as dark lines (figure 21), this is the opposite of transmitted light, where these features would appear as light lines.
[figure 21]
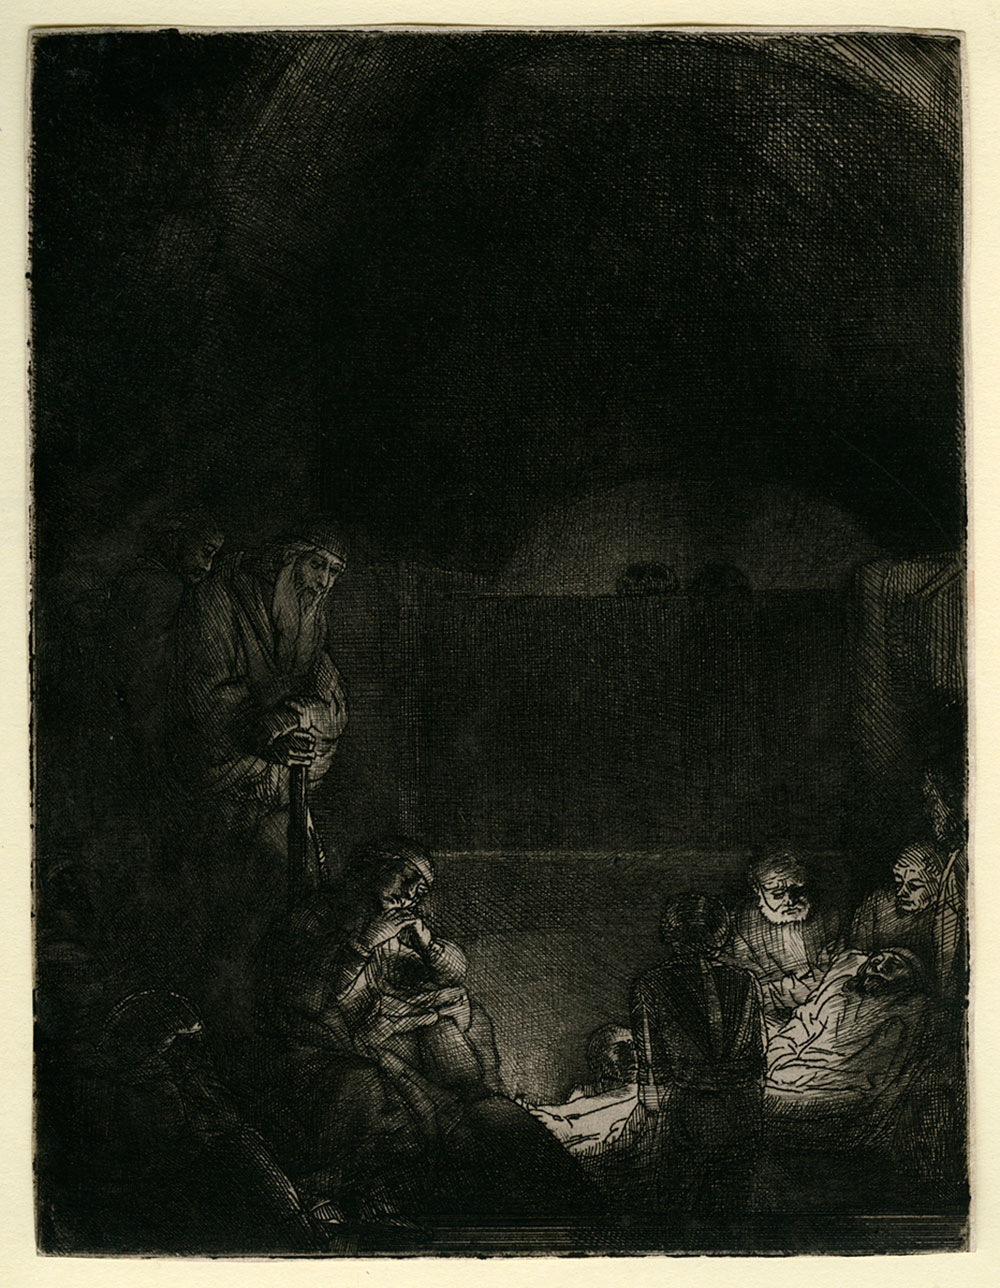
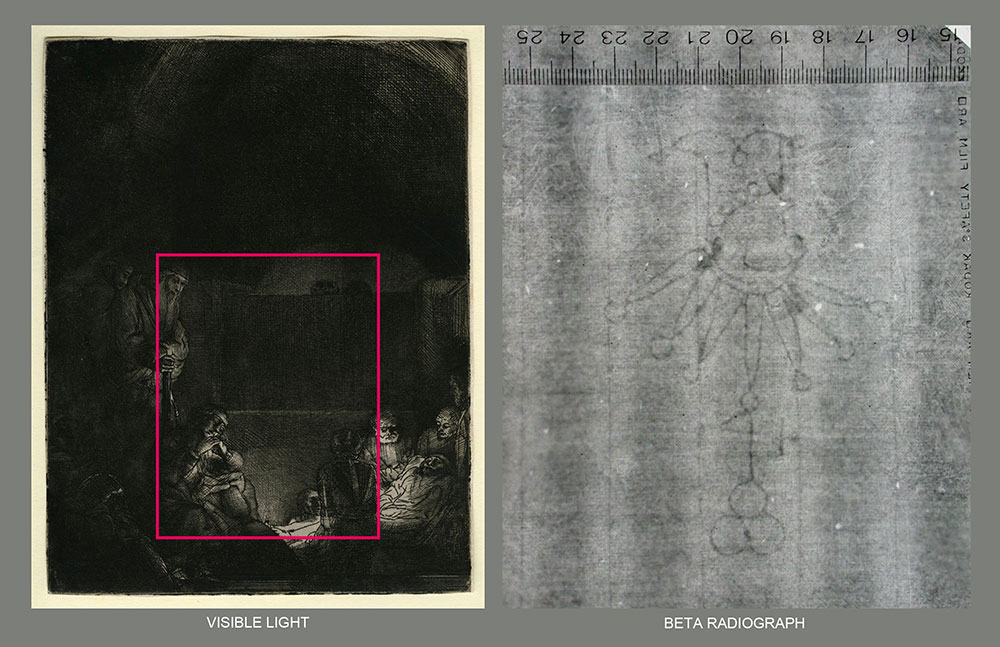
Let’s consider this heavily inked print by Rembrandt (RvR 136; figure 22). Transmitted light can not penetrate the black ink layer to reveal the watermark, but beta particles easily can. The resulting beta radiograph reveals the laid and chain lines, and the paper’s watermark hidden under the ink (figure 23). This is a foolscap watermark typical of seventeenth-century Dutch paper. Beta radiographs of watermarks like this one will soon be available on CORSAIR as part of the Morgan’s individual catalog records.
In the meantime, read more about beta radiographs and watermarks found in Jane Austen’s letters in this post: "Jane Austen's Writing: A Technical Perspective"
[figure 22]
[figure 23]
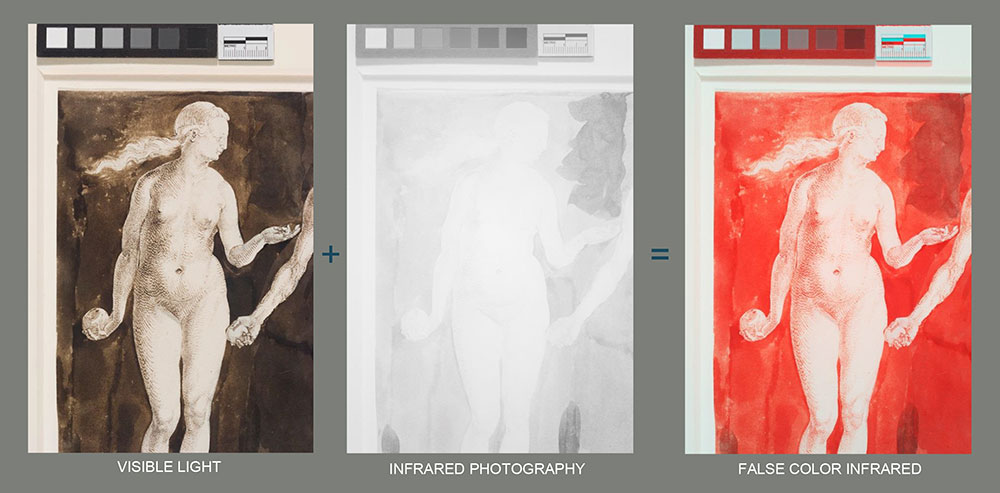
DIGITAL MANIPULATION: FALSE-COLOR INFRARED PHOTOGRAPHY (FCIR)
False-Color Infrared Photography (FCIR) combines a visible light image captured under normal illumination with an IR image to produce a new digital image with characteristic colors that can aid in the identification of media. In this portion of Dürer’s Adam and Eve, 1504 (I, 257d; figure 24), much of the brown ink turns a dramatic red in the FCIR image. This color shift is characteristic of iron gall ink, while carbon-based inks remain black, making it possible to use FCIR photography to distinguish between chemically different inks that look similar in visible light.
Read more about the use of FCIR in the TCC in this post "Technical Analysis of the Crusader Bible." Read a detailed study of this Dürer drawing by Margaret Holben Ellis and Marjorie B. Cohn in “Drawing for Printing: An Expanded Fabrication Narrative for Dürer’s Adam and Eve of 1504,” Master Drawings, Volume 55, Number 4, 2017.
[figure 24]
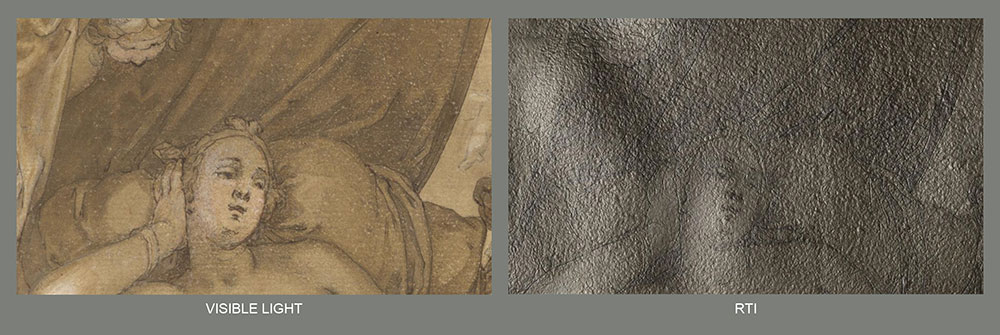
DIGITAL MANIPULATION: REFLECTANCE TRANSFORMATION IMAGING (RTI)
Reflectance Transformation Imaging (RTI) is a photographic method developed by Cultural Heritage Imaging and collaborators, in which multiple digital images of an object are captured using a stationary camera and visible light projected from a number of different angles. These images are then synthesized into a single digital file to create a highly detailed virtual topographic map of the object’s surface that can reveal traces of the artist’s hand, as well as physical characteristics of the paper support.
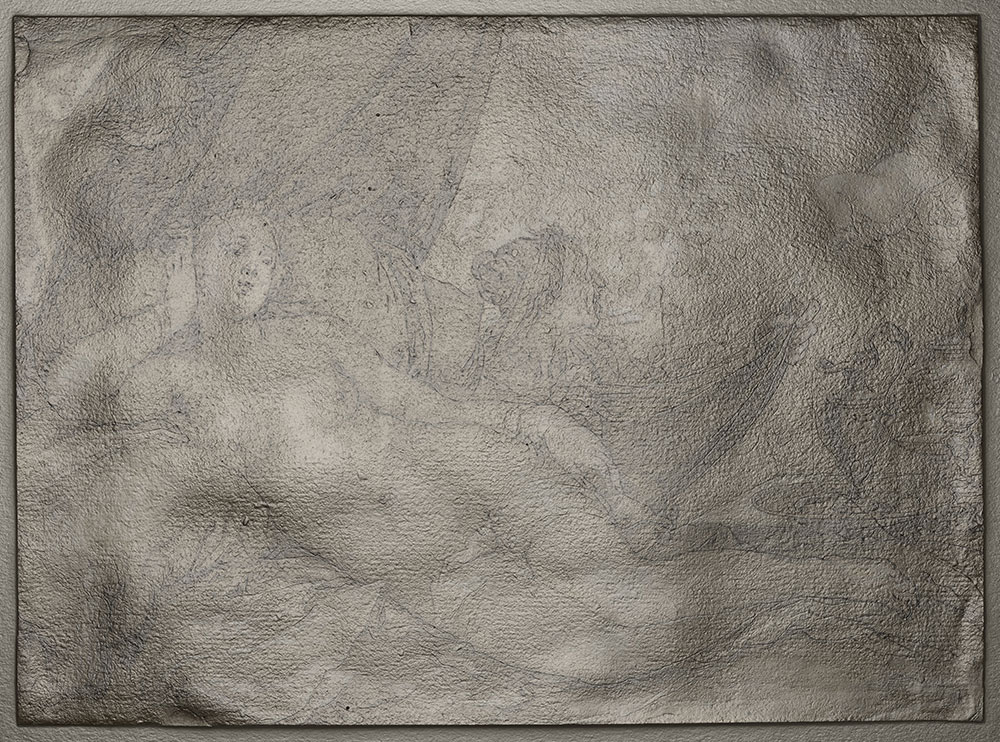
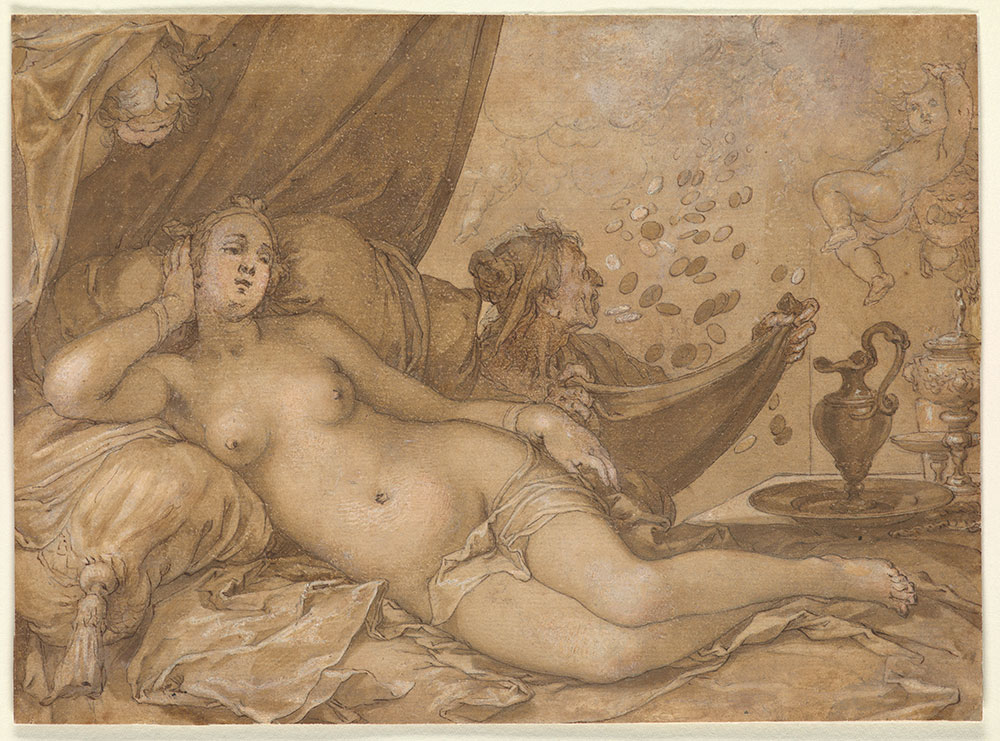
In 2011, the TCC used RTI to document Abraham Bloemaert’s Danaë Receiving the Golden Rain, ca. 1610 (collection of Clement C. Moore; pen and brown ink and brown wash with opaque watercolor, over black chalk. 7 1/4 x 9 7/8 inches/184 x 251 mm; figure 25). The RTI image reveals the paper’s texture and extensive incising of the drawing (figure 26). Note that both the figure of Danaë and the folds of the drapery in the background are fully incised in this detail (figure 27). The incising was done to transfer Bloemaert’s composition to a printing plate and is evidence that firmly links the drawing with the engraving of the same subject.
Read more about the case study and how a drawing is transferred to a printing plate in this post: “From Drawing to Print: Abraham Bloemaert's Danaë Receiving the Golden Rain.”
[figure 25]